Noah Butler · 3 October 2026
Catch Records Over Decades Highlight Changing Coastal Species Patterns
Commercial and recreational fishing logs maintained by government agencies around the world have accumulated detailed catch information since the mid-20th century, and analysts now use these datasets to map how marine species distributions have shifted in coastal zones. Data collection methods include dockside sampling, logbook entries, and observer programs that record species, quantities, locations, and dates, which together create timelines spanning 50 years or more in many regions.
Methods Behind Distribution Tracking
Fisheries scientists aggregate catch per unit effort figures from vessels operating in nearshore waters, then apply statistical models to account for changes in fishing technology and effort levels while researchers cross-reference these numbers with ocean temperature readings and salinity measurements collected by buoys and research vessels. Government bodies such as NOAA Fisheries in the United States and Fisheries and Oceans Canada compile these records annually, and their combined archives now extend through October 2026 with updates that incorporate electronic reporting systems introduced in recent decades.
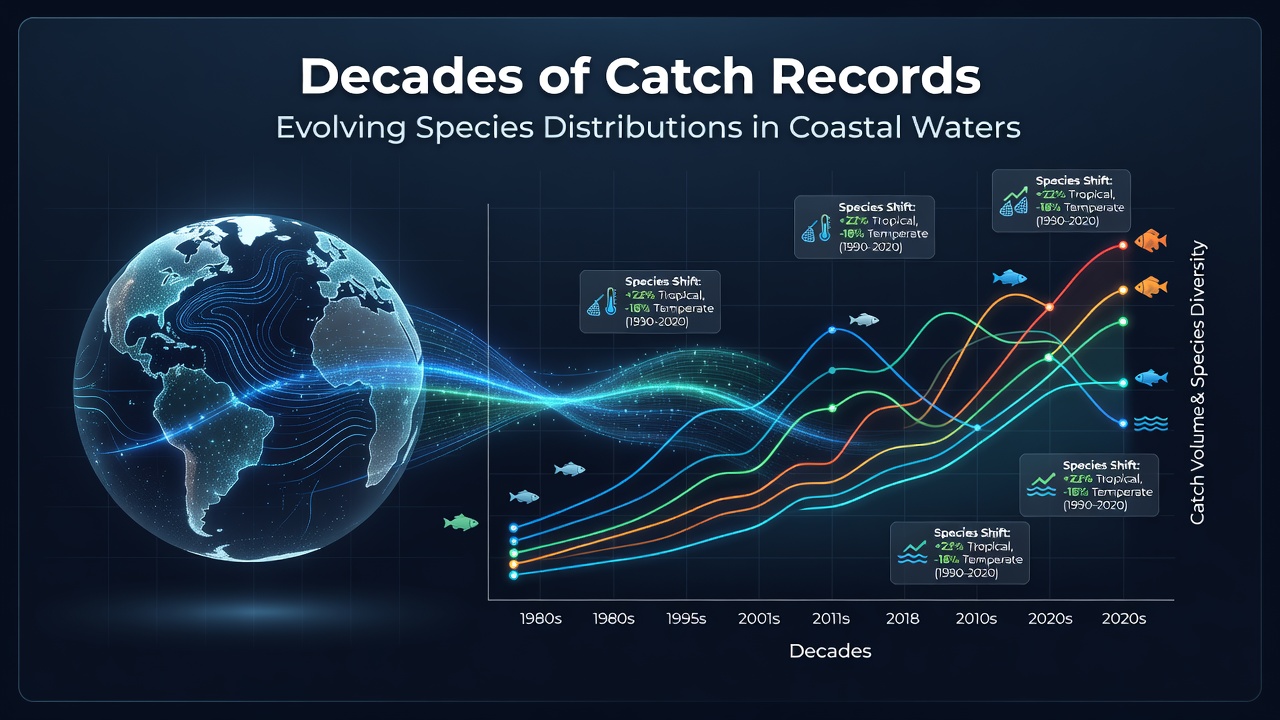
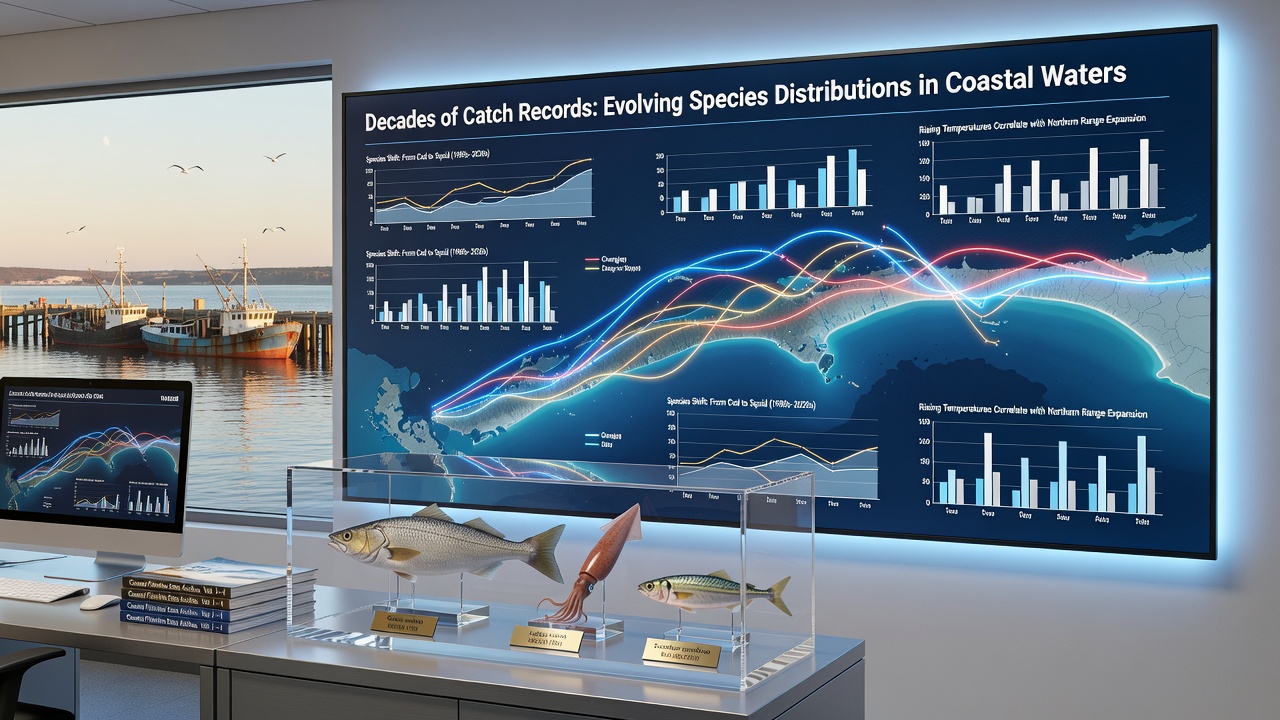
Species such as black sea bass and summer flounder show poleward movements along the Atlantic coast, whereas some cold-water species like Atlantic cod appear less frequently in southern survey areas compared with records from the 1980s. These patterns emerge after analysts normalize data across decades to isolate environmental signals from variations in harvest regulations.
Regional Examples From Multiple Continents
Along the Pacific coast of North America, catch records document increased landings of market squid and Pacific sardine in waters further north than historical averages, while certain rockfish populations have shown contractions in central California zones. European datasets from the North Sea reveal similar trends, with species like anchovy appearing more regularly in catches north of previous ranges and haddock distributions adjusting southward in some years.
Australian fisheries reports track expansions of tropical species such as snapper into temperate coastal zones, and these observations align with sea surface temperature increases measured over the same periods. In each case, the records come from standardized sampling protocols that have remained consistent enough for long-term comparisons even as gear types evolved.
Factors Documented in the Data
Water temperature records paired with catch logs indicate that many species follow thermal preferences when possible, moving to maintain optimal conditions as coastal waters warm at rates documented by oceanographic monitoring programs. Nutrient availability, influenced by river outflows and upwelling patterns, also appears in the analyses as a secondary driver that can amplify or dampen distribution changes.
Harvest pressure itself shows up in the statistics through size and age compositions, yet the spatial shifts persist across both heavily fished and lightly exploited areas, suggesting environmental influences play a substantial role. International bodies like the International Council for the Exploration of the Sea integrate data from multiple nations to produce basin-wide assessments that confirm these coastal patterns extend into deeper waters as well.
Implications for Management and Monitoring
Management agencies adjust quotas and seasonal closures based on updated distribution maps derived from catch records, and these adjustments aim to align regulations with current species locations rather than historical baselines. Electronic monitoring and vessel tracking systems introduced since the early 2000s have improved spatial resolution, allowing finer-scale detection of range expansions or contractions in near real time.
Continued compilation through 2026 and beyond will provide additional data points for modeling future scenarios, while researchers emphasize the value of maintaining consistent sampling methods across political boundaries to support comparable datasets. Collaborative efforts between academic institutions and government agencies have already produced peer-reviewed studies that quantify the magnitude of shifts in kilometers per decade for dozens of commercially important species.
Conclusion
Decades of catch records continue to serve as a primary tool for documenting how coastal marine species redistribute in response to changing ocean conditions. These factual datasets, maintained by agencies across multiple continents, supply the empirical foundation for ongoing monitoring and regulatory updates without reliance on predictive speculation. As new entries accumulate, the historical perspective they offer grows more detailed each year.